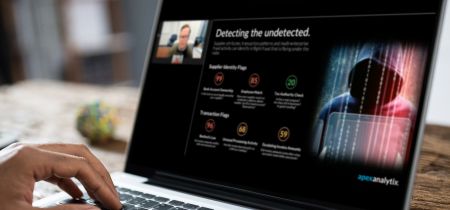
Protect your company’s reputation and revenue from the first time you engage with a supplier and throughout the supplier lifecycle.
-
Platform
-
The apex Neural Engine
Your P2P expert that knows everything, guides human behavior and takes immediate action on your behalf.
-
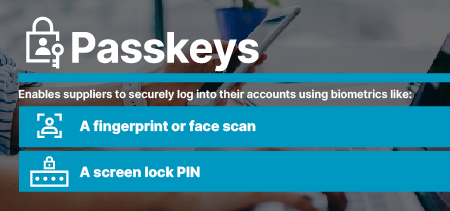
Passkeys User Authentication
The highest level of protection against phishing and fraud. Users can securely login without needing to enter a password.
-
Partners
Strength in unity. There are no problems we cannot solve, together.
-
The apex Neural Engine
-
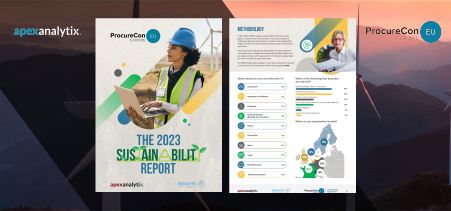
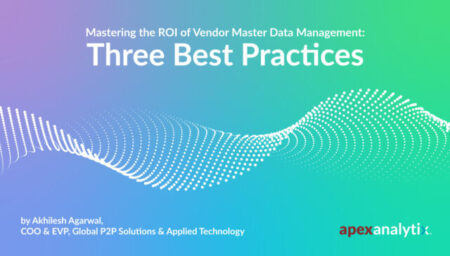
Resources
Explore e-books, white papers, customer-led webinars and more.
- Company
-
Icon Conference
Icon is an exclusive conference attended by leaders of best-in-class, global financial shared services, accounts payable, procurement, post-audit and supplier governance, and risk and compliance organizations.
-
Icon Americas 2025
March 16-18, 2025
-
Icon Americas 2025