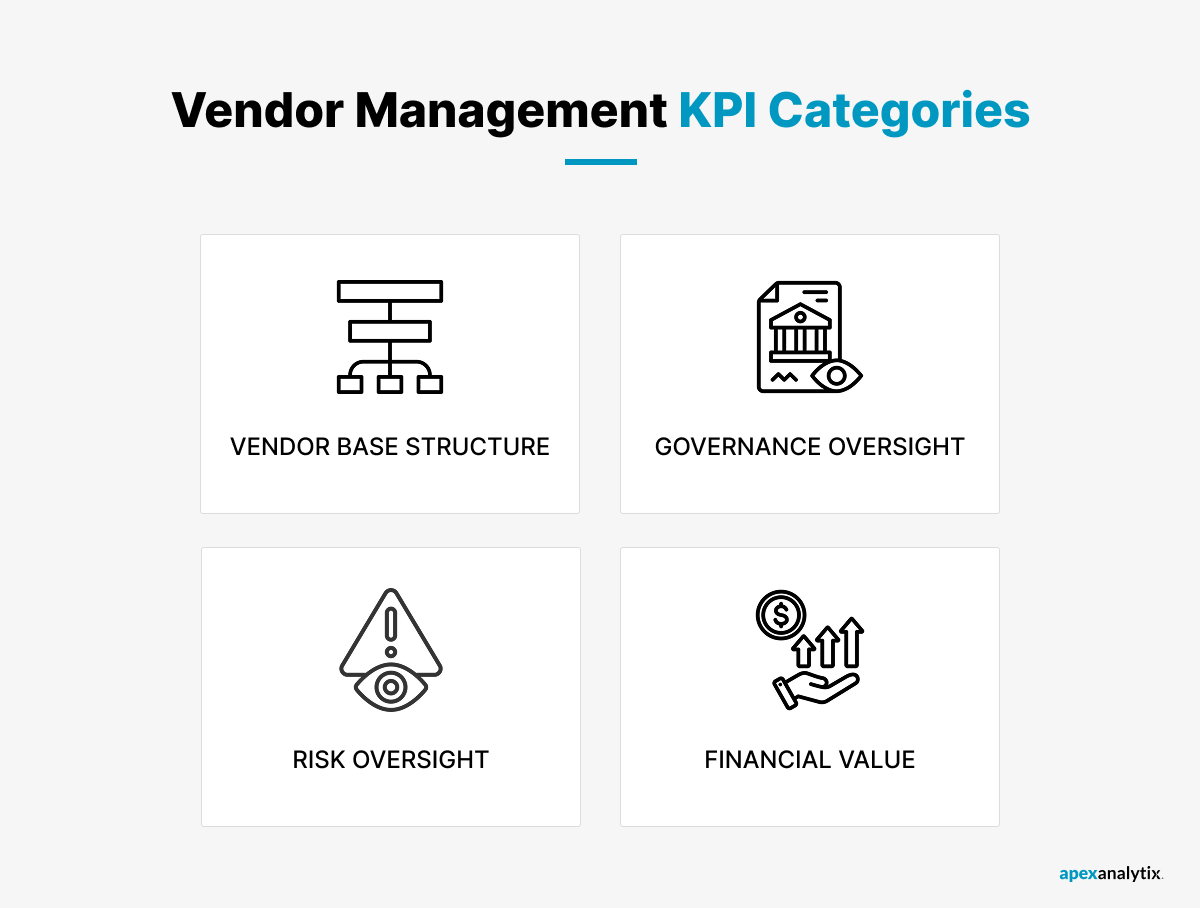
Vendor management KPIs are metrics used to evaluate how well the program overseeing an organization’s vendor base performs across segmentation, governance, risk oversight and financial value.
Portfolio-level gaps often trace back to fragmented ownership and disconnected systems. According to Deloitte’s 2025 Global Chief Procurement Officer Survey, siloed ways of working are the top-ranked barrier to procurement value delivery for 57% of CPOs surveyed. Connected KPIs help teams catch these gaps before they surface as concentrated exposure or unrecovered value.
In this guide, we cover 10 vendor management KPIs to track and ways to apply them to strengthen coverage, reduce risk, and protect financial value across your vendor base.
Key Takeaways:
- Vendor management KPIs measure the program, not the vendor: Portfolio-level coverage, risk oversight, and financial value determine whether the program itself is functioning, not whether one vendor delivered on schedule.
- Portfolio blind spots compound silently: Gaps in segmentation or risk coverage build quietly in the background, with no single alert to flag them until the exposure is already significant.
- Financial value KPIs turn governance into a measurable outcome: Cost savings and value leakage recovery show whether the vendor management function delivers results, not just oversight.
- apexanalytix strengthens the data and controls layer behind these KPIs: The platform’s continuous risk monitoring, centralized vendor data, and connected reporting apply across existing procurement and finance systems.
Vendor Management KPIs at a Glance
The table below summarizes all 10 KPIs, organized by program category.
| KPI |
Formula |
Category |
| Vendor tiering and segmentation coverage rate |
Vendors classified into tiers / total active vendors x 100 |
Vendor base structure and segmentation |
| Spend under active management |
Spend with actively managed vendors / total vendor spend x 100 |
Vendor base structure and segmentation |
| Scorecard currency rate |
Vendors with an updated scorecard / total scored vendors x 100 |
Governance and relationship oversight |
| Business review cadence adherence |
Strategic vendors receiving scheduled reviews / total strategic vendors x 100 |
Governance and relationship oversight |
| Risk monitoring coverage rate |
Vendors under continuous risk monitoring / total active vendors x 100 |
Program-level risk oversight |
| High-risk remediation rate |
Flagged vendors with an active remediation plan / total flagged vendors x 100 |
Program-level risk oversight |
| Cost savings realized vs. negotiated terms |
Savings realized / savings negotiated x 100 |
Financial value and program ROI |
| Contract value leakage recovery rate |
Value recovered / value leakage identified x 100 |
Financial value and program ROI |
| Vendor relationship health score |
Composite score from stakeholder and vendor feedback |
Vendor relationship health |
| Vendor consolidation and rationalization rate |
Reduction in redundant vendor relationships / prior vendor count x 100 |
Vendor relationship health |
What Are Vendor Management KPIs, and How Do They Differ from Supplier Performance Metrics?
Vendor management KPIs measure the program overseeing the full vendor base, not the delivery record of any single vendor.
A supplier performance management KPI tracks whether one vendor met a specific quality, cost, or compliance standard. A vendor management KPI tracks whether the function managing hundreds or thousands of those relationships has adequate coverage, risk visibility, and financial value across the whole portfolio.
The distinction matters because portfolio-level gaps behave differently than individual failures. While a single underperforming vendor is visible and correctable, an unsegmented vendor base or unmonitored risk pocket stays invisible until it surfaces as concentrated exposure or lost recovery.
10 Vendor Management KPIs to Track
Each KPI below falls under one of four areas: vendor base structure, governance oversight, risk oversight, or financial value.
1. Vendor tiering and segmentation coverage rate
This KPI tracks the percentage of active vendors classified into a defined tier, such as strategic, tactical, or transactional.
Why it matters: Untiered vendors receive the same light-touch management regardless of their spend, risk, or strategic importance. A critical supplier with no tier assignment gets the same oversight as a low-value, low-risk vendor.
Formula: Vendors classified into a tier / total active vendors x 100
Who monitors it: Procurement and vendor management leadership
How to improve it: Build tiering into vendor onboarding, so every new vendor is classified from the start. Apply a vendor risk management framework to segment the existing base by risk and spend, rather than tiering vendors manually on an ad hoc basis.
2. Spend under active management
Spend under active management is a KPI that tracks the percentage of total vendor spend flowing through vendors who receive structured oversight, such as scorecards, reviews, or continuous monitoring.
Why it matters: Spend outside active management often correlates with unassessed types of vendor risks, since vendors who receive no oversight are also the least likely to have current risk or compliance data on file.
Formula: Spend with actively managed vendors / total vendor spend x 100
Who monitors it: Procurement, finance, and vendor management leadership
How to improve it: Prioritize bringing high-spend vendors under active management first. Review types of vendor risks to identify which unmanaged categories carry the greatest exposure before expanding oversight further.
3. Scorecard currency rate
Moving into governance and relationship oversight, this KPI tracks the percentage of scored vendors whose performance scorecard has been updated within the defined review window.
Why it matters: A scorecard untouched for months reflects outdated performance data, not current reality. Decisions made from stale scorecards, such as renewal terms, risk the underlying data no longer matching how the vendor performs today.
Formula: Vendors with an updated scorecard / total scored vendors x 100
Who monitors it: Procurement and vendor management teams
How to improve it: Set a fixed review cadence tied to vendor tier, so strategic vendors are scored more frequently than transactional ones. Follow vendor management best practices to build scorecard updates into the review workflow itself.
4. Business review cadence adherence
This KPI tracks the percentage of strategic vendors receiving scheduled business reviews within the defined timeframe.
Why it matters: Strategic vendors carry disproportionate spend, risk, or operational dependency. Skipped reviews mean issues surface later, after they’ve already affected cost or delivery, rather than at a checkpoint built to catch them early.
Formula: Strategic vendors reviewed on schedule / total strategic vendors x 100
Who monitors it: Vendor management and category management teams
How to improve it: Schedule reviews as soon as a vendor is tiered as strategic, and assign clear ownership so review cycles are never missed.
5. Risk monitoring coverage rate
Shifting into program-level risk oversight, this KPI tracks the percentage of active vendors under continuous risk monitoring, covering financial health, cyber posture, sanctions exposure, and compliance status.
Why it matters: A vendor assessed once at onboarding can look very different two years later. Without continuous monitoring, risk changes go undetected between reviews, and the program has no way to know its actual exposure at any given moment.
Formula: Vendors under continuous risk monitoring / total active vendors x 100
Who monitors it: Risk, compliance, and vendor management teams
How to improve it: Extend monitoring beyond the strategic tier alone, since risk can emerge anywhere in the vendor base. Use a vendor risk management checklist to confirm which vendor segments still fall outside continuous coverage.
6. High-risk remediation rate
Also within program-level risk oversight, this KPI tracks the percentage of vendors flagged as high-risk that have an active remediation plan in place.
Why it matters: Identifying risk without acting on it provides visibility, not protection. A high-risk vendor left unaddressed carries the same exposure as one never assessed at all, just with better documentation of the problem.
Formula: Flagged vendors with an active remediation plan / total flagged vendors x 100
Who monitors it: Risk and compliance teams, with escalation to vendor management leadership
How to improve it: Set a required response window for every risk flag, so remediation starts on a fixed timeline rather than an ad hoc one. Assign ownership for each flagged vendor when it’s identified, not after a review cycle surfaces it again.
7. Cost savings realized vs. negotiated terms
Moving into financial value and program ROI, this KPI tracks how much of the savings negotiated at contract signing actually shows up in what the organization pays.
Why it matters: A negotiated discount only creates value if it’s captured at the point of payment. Without tracking this gap, procurement can report savings on paper while AP quietly pays the original rate anyway.
Formula: Savings realized / savings negotiated x 100
Who monitors it: Procurement, finance and AP teams
How to improve it: Compare invoice pricing against contracted terms regularly, not just at renewal. Route pricing exceptions back to procurement so that negotiated terms get enforced at the transaction level, not just the negotiation table.
8. Contract value leakage recovery rate
Also within financial value and program ROI, this KPI tracks how much identified financial leakage, such as pricing discrepancies or missed rebates, actually gets recovered.
Why it matters: Identifying leakage without recovering it is a reporting exercise, not a financial outcome. Value that stays unrecovered past the accounting period it occurred in is effectively a permanent loss.
Formula: Value recovered / value leakage identified x 100
Who monitors it: Finance, AP and internal audit teams
How to improve it: Run a contract compliance audit on a regular basis rather than only after a leakage problem is suspected. Feed recovery findings back into the contracts most prone to leakage, so the same gaps don’t reopen at the next renewal.
9. Vendor relationship health score
Turning to vendor relationship health, this KPI captures a composite score built from internal stakeholder feedback and, where available, vendor-reported satisfaction.
Why it matters: A vendor can meet every contractual metric and still be a difficult relationship to manage day to day. Financial and delivery data alone won’t surface friction that shows up in communication, responsiveness, or dispute resolution.
Formula: Composite score from stakeholder and vendor feedback surveys
Who monitors it: Vendor management and category management teams
How to improve it: Survey internal stakeholders who work with the vendor directly, not just the relationship owner. Apply the benefits of a vendor management system to centralize feedback so it’s tracked consistently across vendors rather than collected informally.
10. Vendor consolidation and rationalization rate
The final vendor relationship health KPI tracks the reduction in redundant or overlapping vendor relationships across the organization over time.
Why it matters: A vendor base that keeps growing without consolidation spreads oversight thinner across more relationships. Redundant vendors also mean duplicated spend and diluted negotiating leverage with any single supplier.
Formula: Reduction in redundant vendor relationships / prior vendor count x 100
Who monitors it: Procurement and vendor management leadership
How to improve it: Review the vendor base by category to identify overlapping suppliers serving the same need. Apply supplier lifecycle management principles to offboard redundant vendors deliberately, rather than letting the base grow unchecked.
How to Prioritize Vendor Management KPIs
Not every KPI on this list needs equal attention from day one. Prioritization should follow where the biggest blind spots sit, working roughly in this order:
- Start with segmentation: A vendor base with no tiering has no way to know which relationships warrant scorecards, reviews, or continuous risk monitoring in the first place.
- Move to risk monitoring and remediation next: Unmonitored risk carries the highest downside of any gap on this list, since nothing in ordinary reporting flags it until a disruption forces the issue.
- Layer in financial value KPIs once the foundation is in place: Cost savings and value leakage recovery are only actionable after segmentation and risk oversight give the program something reliable to act on.
- Track relationship health as an ongoing signal: While it matters throughout, relationship health is best measured continuously rather than fixed as a one-time score.
How apexanalytix Strengthens Vendor Management KPI Tracking
Tracking these KPIs only works when the underlying vendor data is accurate, centralized, and current. Many organizations still manage segmentation, risk and financial data across disconnected systems, which is exactly why blind spots at the program level stay invisible for so long.
apexanalytix closes that gap by building vendor management on unified vendor data, continuous risk monitoring, and connected financial recovery, rather than treating each KPI as a separate reporting exercise. Every vendor record is enriched against 1,200+ trusted data sources, giving procurement, risk and finance teams one accurate view to segment, tier and monitor the full vendor base.
From there, risk monitoring extends across every active vendor rather than the strategic tier alone, so coverage gaps surface before they turn into blind spots. Recovery audit capabilities connect directly to that same vendor record, so financial value tracking never runs as a separate initiative from segmentation or risk data.
Key ways apexanalytix supports vendor management KPI tracking include:
Here’s what the platform’s capabilities look like in the real world:
- A vendor master cleansing initiative spanning 35,000+ supplier records across nearly 30 databases identified nearly 900 duplicate records and nearly 6,000 suppliers with invalid bank information, giving the organization accurate segmentation and coverage data across its full vendor base for the first time.
- A global energy supermajor managing 200,000+ suppliers and $40B in annual spend built risk visibility across its full vendor base, validating bank account ownership across 13 countries and maintaining compliance continuity through two acquisition events.
These examples show what’s possible once a vendor management program has the visibility to act on what these KPIs reveal.
Ready to strengthen visibility across your vendor management program?
Contact apexanalytix to see how centralized vendor data, continuous risk monitoring, and recovery audit work together across your full vendor base.
FAQs
1. How is a vendor management KPI different from a supplier performance KPI?
A supplier performance KPI evaluates a single vendor’s delivery, quality or cost. A vendor management KPI evaluates the program overseeing the entire vendor base, such as segmentation coverage, risk monitoring reach, and financial value recovery.
2. How many vendor management KPIs should an organization track?
Most organizations get the clearest picture from four to six KPIs spanning segmentation, risk oversight, and financial value, rather than tracking all ten in full detail from the start.
3. How often should vendor management KPIs be reviewed at the program level?
Risk and financial value KPIs benefit from monthly or quarterly review, since exposure and recovery opportunities change quickly. Segmentation and relationship health metrics shift more slowly and suit a semi-annual cadence.